
[If the name ‘Miggo’ is familiar to you in the context of my blogging, you are thinking about one I wrote titled “Miggo Security’s AI Slop & Potential Trademark Infringement” in July, 2025. That was more around ‘corporate’ culture and bad lawyering. This blog is different, pointing out how they don’t seem to understand KEV at all.]
On November 18, 2025, Miggo published a report titled “Missing 88% of Exploits: Rethinking KEV in the AI Era“. Their conclusion is that CISA’s KEV is “missing” a significant number of vulnerabilities. However, that conclusion is based on a horrible misunderstanding of .. many things. Every time I write a sentence here I re-read their conclusion wondering if I am misreading it. I honestly hope I am every time but I don’t think so. Using the lengthy Executive Summary linked above, let’s focus on the core misunderstanding and the methodology that got them there.
In this study, Miggo Security analyzed over 24,000 vulnerabilities from GitHub’s public open source advisory (GHSA), mapped 572 associated exploits, and compared their presence against the CISA KEV catalog – and found that 88% of CVEs with exploits don’t appear in KEV.
With this small quote, you might immediately recognize a problem. Miggo sought to compare vulnerabilities with a public exploit against CISA’s Known Exploited Vulnerabilities catalog. That catalog represents confirmed exploitation of a vulnerability against any asset that CISA believes may impact their stakeholders. It’s important to understand that it is more nuanced than just “federal and critical infrastructure” and I go into more detail on that in a prior blog. The words Miggo uses say they are comparing “exploit published” versus “exploits used in the wild”. Those are very different things. Granted, they disclaim this right after:
While the presence of a public exploit doesn’t guarantee that an exploit attempt has occurred, it is a serious indicator of both potential and actual exploit risk.
So they spell out what they are comparing, then immediately say you can’t compare them. But that doesn’t stop them from going on! Their big take-away and shocking numbers seem to be based on ignoring the disclaimer.
In this case, based on the proprietary PVD, Miggo’s research team analyzed more than 24,000 open source vulnerabilities drawn from the GitHub Security Advisory (GHSA) database, spanning major ecosystems such as npm, PyPI, Maven, and RubyGems. Within this dataset, the team identified over 1,000 vulnerabilities that included at least one link to a GitHub-hosted exploit repository. The analysis focused exclusively on GHSA advisories to ensure consistency and verifiable sourcing.
This methodology seems valid on the surface, but it only took me one search in VulnDB to immediately question it. We don’t maintain a 100% one-to-one mapping of all GHSA to our entries, primarily due to many of them not adding any new details. Of the cases where we do map, searching for “GHSA” + “Exploit Public”, I got 5,413 results at the time of the Miggo report publication. So using GHSA for “consistency and verifiable sourcing” doesn’t sound convincing. Further, GHSA will create advisories for every CVE now which includes junk software that is likely not to see exploit attempts or be KEV. Even if exploit attempts are observed, the odds of anyone running the software is slim, let alone enterprises or governments.
For example, let’s take GHSA-746r-3x8x-jmcc which covers “oretnom23 Stock Management System sms/classes/Login.php username Parameter Authentication Bypass SQL Injection” (that’s the VulnDB title, not GHSA). That is open-source software with a public exploit. But is there a chance we will see confirmed, successful exploitation in the wild? Sure, but it is as close to 0% as you can get. This is an example of software that is being abused for CVE Farming, which I wrote about in early 2025. Hobby PHP software that is forked and re-skinned for different industries, yet containing most or all of the same vulnerabilities as the prior iteration.
With the prevalence of vulnerability disclosures in these hobby PHP projects, that alone can severely skew any such methodology or resulting claims. Miggo, who has a “predictive vulnerability database” and vague wording is likely entirely CVE based. That means they are largely doing meta-analysis of vulnerabilities, not working with the base data on a day-by-day basis. At the time of publication, VulnDB has aggregated 1,215 vulnerabilities in oretnom23 software alone. He is one of many dozens of hobbyists churning out this junk software. That should give a better perspective on how much this can skew statistics.
That’s also the tip of the iceberg, unfortunately. The junk software and general CVE Farming problem extends to a lot more. Regardless of that volume, a huge problem we face is how many CVE IDs get assigned for the exact same vulnerability. Whether by accident or intentional via crafted descriptions, these disclosures still get unique CVE IDs. Let’s look at one example in an oretnom23 package where one vulnerability got two assignments:
CVE-2022-31974 (GHSA-g4cm-mg48-gf2f)
Online Fire Reporting System v1.0 is vulnerable to SQL Injection via /ofrs/admin/?page=reports&date=.
CVE-2022-31879 (GHSA-76rw-mc6q-q7vr)
Online Fire Reporting System 1.0 is vulnerable to SQL Injection via the date parameter.
The first does explicitly say which parameter is vulnerable, and the second does not give an affected endpoint. Without looking at the disclosures you can’t be certain if these are the same. But no less than a minute of examining those disclosures is required to determine that. Since it received two CVE IDs, there were two resulting GHSA advisories. Now we have more of a skew in Miggo’s methodology. But, how often does that happen? A LOT. And that bold does not begin to emphasize just how bad it is. And yet, those could have factored into Miggo’s conclusion and numbers.
To put an exclamation on that point, let’s examine VulnDB 265151 which we title as “oretnom23 Multiple Products /classes/Master.php id Parameter SQL Injection”. When you notice “multiple products”, you may be wondering how many and that is exactly the question to ask! Again, a LOT.
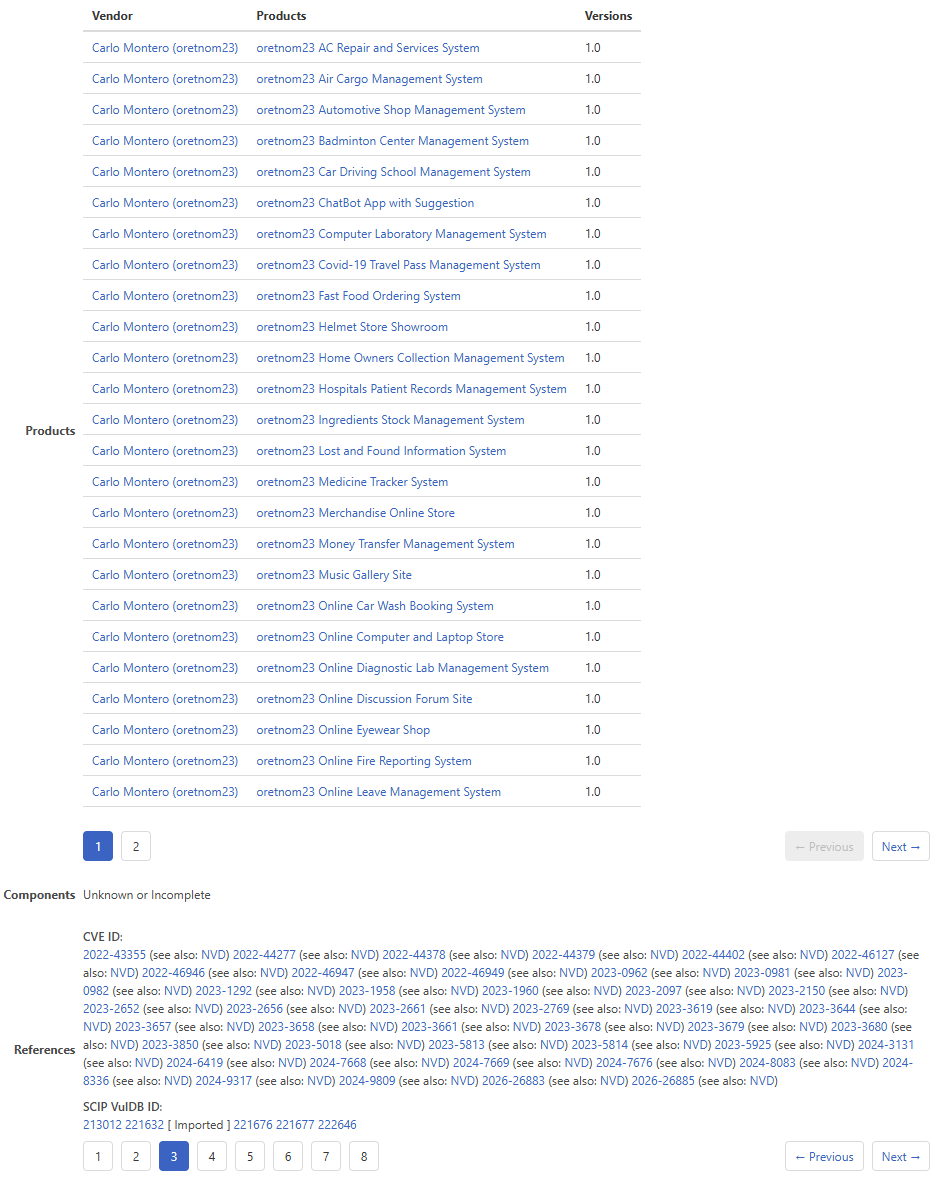
That list of CVE IDs is around one third of the total. Pages one and two are full of additional IDs. In each case, regardless of how the CVE description reads or how the (almost exclusively) amateur vulnerability “researchers” disclose or describe, it’s the same damn thing. How many of those CVE IDs received corresponding GHSAs? How many of those factored into Miggo’s research and resulting conclusions? If you wonder why they should be merged into one entry like this, it’s no different than Microsoft and Windows. We don’t assign a separate CVE ID for one vulnerability that affects Windows 8, Windows 10, and Windows 11. Same code base, same vulnerability, one ID.
I suspect that Miggo is also factoring in Exploit Prediction Scoring System (EPSS) although they do not say that in the executive summary or report. But it is a go-to for getting scoring around the “probability” of exploitation. In this case, one of those CVE IDs above are scored as EPSSv1 8.7% and EPSSv3 48.2%. Almost a 50 percent chance of exploitation?! I doubt it. Regular citizens are not going to run “oretnom23 Water Billing Management System” or “oretnom23 Online Railway Reservation System”. If they are, it’s on a home network and not exposed to the Internet unless by error, or they just like exposing themselves to risk for no reason. Even in such a case where it is exploited, it is quite literally likely to be a single person ever.
Realistically, you simply cannot use this methodology for any meaningful conclusions. When you use bad data you get bad conclusions. That said, the real offense this report commits is not just the bad methodology, but using inflammatory language like “Despite CISA’s commitment to keep its catalog up to date…”. Their commitment isn’t to cover “all known KEV”, as Miggo themselves point out, albeit with more narrow language than reality. VulnCheck shows that KEV numbers are much higher. 4,691 at the time of this blog, and Flashpoint is currently tracking 6,855. If EPSS is to be trusted, the corpus used for creating their algorithm is well over the 9,218 CVEs mentioned here.
I can’t find it right off, but early on EPSS claimed to have over 13,000 vulnerabilities known to be exploited. I was immediately dubious of that based on their data sources (e.g. Fortinet), and Patrick Garrity subsequently posted concerns over how that data may not be reliable for training such models as EPSS. Looking at Fortinet’s Fortiguard Encyclopedia, specifically Intrusion Detection events with ‘telemetry’, meaning they have detected some network activity that matches a given vulnerability. That database currently shows 20,604 meaning the prior KEV numbers are all woefully behind. But are they all valid? That is what Garrity calls into question since all of those could have been used to train EPSS.
Miggo! That’s who we were talking about, but that rabbit hole above is just one of so many nuances of all of this. On top of all of the above, remember that these projects and companies are based on CVE. I just posted another reminder that CVE != vulnerability, in several ways. There is not a consistent one-to-one mapping for vulnerabilities to CVE, CVE misses tens of thousands of vulnerabilities a year, it’s full of duplicates, and that the YEAR prefix of the CVE ID doesn’t necessarily correspond to the year it was disclosed. That’s why aggregating the base data is important, and doing it with a more rigorous approach and collecting more metadata allows for better analysis.
BETTER DATA MATTERS
With all that in mind, let’s go back to Miggo’s claim: “That means KEV “missed” 88% of real exploits.” Do we believe that? No. Once again, that is them ignoring their own disclaimer and then comparing published exploits to exploitation activity, which are very different things.
When you read reports about vulnerabilities, especially making conclusions or throwing numbers around, ask questions. Look for the disclaimers, and there should be more than one for sure. See if the author shares nuances and rabbit holes. Determine if they work with vulnerability disclosure analysis, or ‘meta’ analysis of that data once it is aggregated. The latter don’t understand the pitfalls of that aggregated data or how it impacts cataloging, and will use the messy data as-is, often resulting in bad conclusions and statistics. Watch for that inflammatory language that boils down to pushing Fear, Uncertainty, and Doubt (FUD). If you see it, walk away if they can’t answer all of your questions in exquisite detail.

Leave a Reply