[I wrote this for my day job back in February, 2017, but it never got posted. Including it here for reference.]
The notion of expertise in any field is fascinating. It crosses so many aspects of humans and our perception. For example, two people in the same discipline, each with the highest honors academic can grant, can still have very different expertise within that field. Society and science have advanced so we don’t just have “science” experts and medical doctors can specialize to extreme degrees. Within Information Security, we see the same where there are experts in penetration testing, malware analysis, reverse engineering, security administration, and more.
In the context of a software company, especially one that does not specifically specialize in security (and is trivial to argue was late to the security game), you cannot shoehorn them into any specific discipline or expertise. We can all absolutely agree there is an absolute incredible level of expertise across a variety of disciplines within Microsoft. So when Microsoft releases yet another report that speaks to vulnerability disclosures, the only thing I can think of is duality. Especially in the context of a report that puts forth some expertise that they are uniquely qualified to speak on, while mixed with a topic that predates Microsoft and they certainly aren’t qualified to speak on to some degree.
A Tweet from Carsten Eiram pointed me to the latest report, and brought up the obvious fact that it seemed to be way off when it comes to vulnerability disclosures.
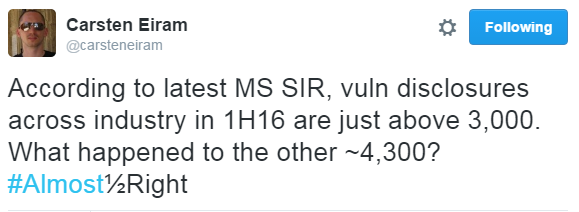
The MS SIR he refers to is the Microsoft Security Intelligence Report, Volume 21 which covers “January through June, 2016” (direct PDF download).
It’s always amusing to me that you get legal disclaimers in such analysis papers before you even get a summary of the paper:
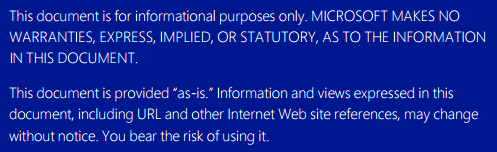
Basically, the takeaway is that they don’t stand behind their data. Honestly, the fact I am blogging about this suggests that is a good move and that they should not. The next thing that is fascinating is that it was written by 33 authors and 14 contributors. Since you don’t know which of them worked on the vulnerability section, it means we get to hold them all accountable. Either they can break it down by author and section, or they all signed off on the entire paper. Sorry, the joys of academic papers!
After the legal disclaimers, then you start to get the analysis disclaimers, which are more telling to me. Companies love to blindly throw legal disclaimers on anything and everything (e.g. I bet you still get legal disclaimers in the footer of emails you receive, that have no merit). When they start to explain their results via disclaimers while not actually including their methodology, anyone reading the report should be concerned. From their “About this report” section:
This volume of the Microsoft Security Intelligence Report focuses on the first and second quarters of 2016, with trend data for the last several quarters presented on a quarterly basis. Because vulnerability disclosures can be highly inconsistent from quarter to quarter and often occur disproportionately at certain times of the year, statistics about vulnerability disclosures are presented on a half-yearly basis.
This is a fairly specific statement that speaks as if it is fact that vulnerability trends vary by quarter (they do!), but potentially ignores the fact that they can also vary by half-year or year. We have seen that impact not only a year, but the comparison to <strong>every year prior</strong> (e.g. Will Dormann in 2014 and his Tapioca project). Arbitrarily saying that it is a ‘quarter’ or ‘half-year’ does not demonstrate experience in aggregating vulnerabilities, instead it is a rather arbitrary and short time-frame. Focusing on a quarter can easily ignore some of the biases that impact vulnerability aggregation as outlined by Steve Christey and my talk titled “Buying Into the Bias: Why Vulnerability Statistics Suck” (PPT).
Jumping down to the “Ten years of exploits: A long-term study of exploitation of vulnerabilities in Microsoft software” section, Microsoft states:
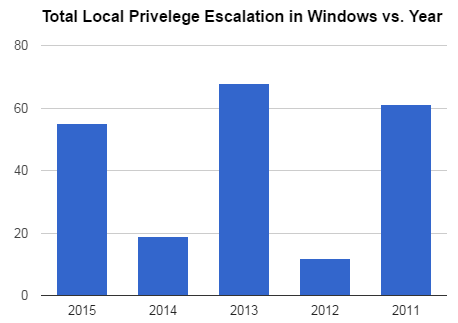
However, despite the increasing number of disclosures, the number of remote code execution (RCE) and elevation of privilege (EOP) vulnerabilities in Microsoft software has declined
significantly.
Doing a title search of Risk Based Security’s VulnDB for “microsoft windows local privilege escalation” tells a potentially different story. While 2015 is technically lower than 2011 and 2013, it is significantly higher than 2012 and 2014. I can’t say for certain why these dips occur, but they are very interesting.
Thousands of vulnerabilities are publicly disclosed across the industry every year. The 4,512 vulnerabilities disclosed during the second half of 2014 (2H14) is the largest
number of vulnerabilities disclosed in any half-year period since the Common Vulnerabilities and Exposures system was launched in 1999.
This quote from the report explicitly shows serious bias in their source data, and further shows that they do not consider their wording. This would be a bit more accurate saying “The 4,512 vulnerabilities aggregated by MITRE during the second half of 2014…” The simple fact is, a lot more than 4,512 vulnerabilities were disclosed during that time. VulnDB shows that they aggregated 8,836 vulnerabilities in that same period, but less than the 9,016 vulnerabilities aggregated in the second half of 2015. Microsoft also doesn’t disclaim that the second half of 2014 is when the aforementioned Will Dormann released the results of his ‘Tapioca’ project totaling over 20,500 vulnerabilities, only 1,384 of which received CVE IDs. Why? Because CVE basically said “it isn’t worth it“, and they weren’t the only vulnerability database to do so. With all of this in mind, Microsoft’s comment about the second half of 2014 becomes a lot more complicated.
The information in this section is compiled from vulnerability disclosure data that is published in the National Vulnerability Database (NVD), the US government’s repository of standards-based vulnerability management data at nvd.nist.gov. The NVD represents all disclosures that have a published CVE (Common Vulnerabilities and Exposures) identifier.
This is a curious statement, since CVE is run by MITRE under a contract from the Department of Homeland Security (DHS), making it a “US government repository” too. More importantly, NVD is essentially a clone of CVE that just wraps additional meta-data around each entry (e.g. CPE, CWE, and CVSS scoring). This also reminds us that they opted to use a limited data set, one that is well known in the Information Security field as being woefully incomplete. So even a company as large as Microsoft, with expected expertise in vulnerabilities, opts to use a sub-par data set which drastically influences statistics.
Figure 23. Remote code executable (RCE) and elevation of privilege (EOP) vulnerability disclosures in Microsoft software known to be exploited before the corresponding security update release or within 30 days afterward, 2006–2015.
The explanation for Figure 23 is problematic in several ways. Does it cherry pick RCE and EOP while ignoring context-dependent (aka user-assisted) issues? Or does this represent all Microsoft vulnerabilities? This is important to ask as most web browser exploits are considered to be context-dependent and coveted by the bad guys. This could be Microsoft conveniently leaving out a subset of vulnerabilities that would make the stats look worse. Next, looking at 2015 as an example from their chart, they say 18 vulnerabilities were exploited and 397 were not. Of the 560 Microsoft vulnerabilities aggregated by VulnDB in 2015, 48 have a known public exploit. Rather than check each one to determine the time from disclosure to exploit publication, I’ll ask a more important question. What is the provenance of Microsoft’s exploitation data? That isn’t something CVE or NVD tracks.
Figure 25 illustrates the number of vulnerability disclosures across the software industry for each half-year period since 2H13
Once again, Microsoft fails to use the correct wording. This is not the number of vulnerability disclosures, this is the number of disclosures aggregated by MITRE/CVE. Here is their chart from the report:
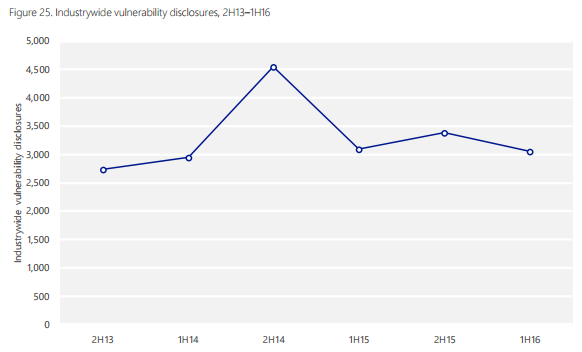
Under the chart they claim:
Vulnerability disclosures across the industry decreased 9.8 percent between 2H15 and 1H16, to just above 3,000.
As mentioned earlier, since Microsoft is using a sub-par data set, I feel it is important to see what this chart would look like using more complete data. More importantly, watch how it invalidates their claim about an industry decrease of 9.8 percent between 2H15 and 1H16, since RBS shows the drop is closer to 18%.

I have blogged about vulnerability statistics, focusing on these types of reports, for quite a while now. And yet, every year we see the exact same mistakes made by just about every company publishing statistics on vulnerabilities. Remember, unless they are aggregating vulnerabilities every day, they are losing a serious understanding of the data they work with.
Leave a Reply