
[This was originally published on RiskBasedSecurity.com.]
In every quarterly Vulnerability QuickView Report, we include a chart that shows how many vulnerabilities were disclosed so far that year, along with the most current counts of prior periods to show relative growth and decline.
In some cases, like this year’s Q1, that chart shows a decline compared to the previous year and we disclaim how it may or may not be a true drop in numbers.
For example, in in our 2019 Year End Vulnerability QuickView Report, we noted a slight (4%) decrease in vulnerabilities between 2018 and 2019, despite a steady increase year after year in previous years. If you look at those numbers now, there’s actually a 1.9% decrease, which is a lesser drop than we reported previously. This is because, though 2019 has come to a close, we will continue to find and publish vulnerabilities that were disclosed in 2019 but not included in VulnDB during the last year. Similarly, throughout 2020, we will continue to find issues disclosed in January, February and March and publish them, even outside of the timeframe of Q1.
As time goes on, this number of “backfilled” additions to Q1 2020 will get smaller and smaller until our current research effort will effectively stabilize, arriving at the “true” number of vulnerabilities disclosed in Q1 2020. It may take several years to fully determine that number, but we want to be as precise as possible, for ourselves and for our customers.
Why does this “backfill” happen? At the time of this report, we currently monitor over 4,000 sources on an hourly, daily, or weekly basis. Just a year ago, that number was close to 3,000, meaning we have added an average of 3.5 sources per day since then. That explosive growth in source coverage is one way we continue to provide the best vulnerability intelligence for our clients. With each source comes the “backfill”; once a source is identified, we have to go through the historical content to look for vulnerabilities not just from this year, but in years prior. That may lead us to find vulnerabilities from the prior quarter or year, or even from ten years ago.
Predicting the “True” Count
If we know the rate at which our backfill impacts our vulnerability counts, we can estimate what the “true” count might be for the current period and, with confidence, determine if there really has been a decline in Q1 2020 compared to prior years. We can actually extrapolate that now by looking at previous years’ totals (as reported immediately after Q1 of those years), and see how much those counts increased year-by-year. For example, here is 2017:
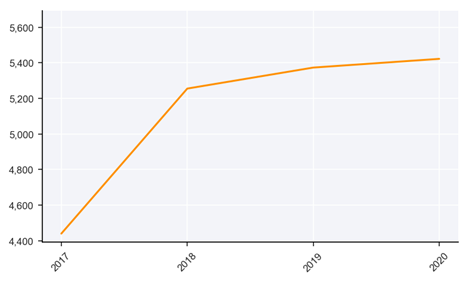
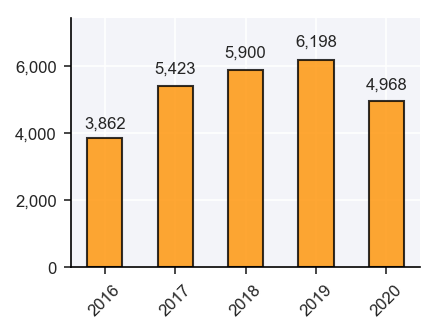
By the time Q1 2017 ended, our VulnDB team published 4,440 vulnerabilities that were specifically disclosed in January, February, and March of that year.
During the remainder of 2017 and 2018, we discovered an additional 815 vulnerabilities that were technically disclosed in Q1 2017, that were later published by RBS. This increased the previous total of Q1 2017 vulnerabilities (4,440) by roughly 18%, to 5,255. At the end of 2019, the count had grown again, but by only 2.2%. At the end of Q1 2020, the count for Q1 2017 vulnerabilities is now 5,422, a growth of less than 1%. Overall, while pursuing our goal of serving our clients’ best interests, it took three years of backfilling to get a more accurate picture of how many vulnerabilities were disclosed in 2017. This trend is fairly consistent, and the end result is that we see our “raw count” (the one we publish fresh off the press) mature to a steady future state within a period of three years.
Based on prior trends, we expect the count for Q1 2019 to reach 6,432 once it stabilizes in 2022. Similarly, we expect to see the count for vulnerabilities disclosed in Q1 2020 to converge on 6,126, which indicates that we really may be seeing a slight dip in vulnerabilities in Q1 2020 as compared to the same period in 2019. We’ll have to set calendar reminders to revisit these predictions.
What Happens When We Apply the Same Level of Scrutiny to CVE?
Now, a natural question: how does CVE stack-up? The number of vulnerabilities disclosed in a single quarter, as reported by CVE, will grow by over 70% before reaching a consistent number. For example, while we initially published 4,440 vulnerabilities in Q1 2017, they published only 1,756 in that same period. Based on our analysis of CVE prior performance, CVE is on track to publish around 3,158 vulnerabilities for Q1 2017, if we extrapolate the model seven years into the future.

While their subsequent backfill, after seven years, nearly doubles the vulnerability count, CVE still misses nearly 2,300 vulnerabilities compared to VulnDB. Lost time is the killer of vulnerability management and CVE simply cannot be relied upon for timely information. Even after three years, they haven’t reached the total vulnerabilities initially reported by VulnDB in Q1 of 2017. On top of that, though the rate at which they’re uncovering and publishing vulnerabilities is decreasing rapidly, they have still not stabilized and their count is still growing by a few percent. This is partly because they will publish vulnerabilities using a CVE ID created years after initial disclosure, and label it as growth, even though it is simply something that was missed.
At their current rate, CVE will never reach the level of vulnerability knowledge that VulnDB has right now.
Leave a Reply