I’ve been in the security arena for some time now, like many of my friends and colleagues. For over a decade, we have been presented with several vendors that deliver yearly reports summarizing various attributes of the industry: vulnerabilities, hack attacks, spam, malware, breaches, and more. They are typically delivered in summaries that can be read by any level of an organization. More recently, they center around ‘infographics‘ that attempt to convey the major points in an aesthetic fashion.
Most reports are released with a lot of fanfare; news articles that praise the report, hem and haw over the findings, and tell users things are bad. What we rarely see is any establishment, news or otherwise, challenge the data. The few that do are typically lost in the mass of blogs and are given as much scrutiny as the articles they debunk. Even when data is out there to quickly refute such a report, the people seeking to do so are few and far between; even when it is their job to do so.
The reason? Security companies, professionals, and journalists are complacent. They are happy to get the numbers that help them. For some, it sells copy. For others, it gets security budget. Since it helps them, their motivation to question or challenge the data goes away. They never realize that their “threat intelligence” source is stale and serving up bad data.
All of this came up again with today’s release of the Symantec Internet Security Threat Report (ISTR) [Full report – PDF]. Note that I am an officer of the Open Security Foundation (OSF), and we track two of the many general data points that Symantec does. We run a vulnerability database, and we run a database that tracks breaches. Symantec has previously used OSF breach data, but recently stopped after being informed that it was not acceptable to do so commercially without a license. I believe this is the first report that uses their own. And it shows. That said, I am only going to focus on vulnerability data, as that is my real area of interest and where I spend a majority of waking hours.
In addition, Symantec maintains one of the world’s most comprehensive vulnerability databases, currently consisting of more than 51,644 recorded vulnerabilities (spanning more than two decades) from over 16,687 vendors representing over 43,391 products.
Given the number of vulnerability databases (VDBs) out there, at least ones that could be considered sizable by any measure, this is technically true. However, the rest of the quoted material reminds us that they are not even close to comprehensive, and their numbers are in line with specialty databases that focus on a specific purpose or type of information. According to the report, they cataloged 6253 vulnerabilities in 2010, 4989 in 2011, and 5291 in 2012. To put that into perspective, that is 2877 less than IBM/ISS X-Force, 4485 less than Secunia (note: their abstraction will result in duplicates and a higher count to some degree), and 1289 less than CVE/NVD, which is the “no child left behind” of VDBs. Seriously, Symantec isn’t even keeping a 100% mapping to CVE, and they call their database “comprehensive”. Symantec’s 5291 vulnerabilities in 2012 is approximately 58% of the vulnerabilities cataloged by OSVDB. As one project moderator said, a generous professor might even round that to a D-.
Looking further, Symantec’s report says they cataloged 14 ‘zero day’ vulnerabilities in 2010, 8 in 2011, and 14 in 2012. In this context, ‘zero day’ means “A zero-day vulnerability is one that is reported to have been exploited in the wild before the vulnerability is public knowledge and prior to a patch being publicly available.” This is basically the same definition OSVDB uses for our “Discovered in the Wild” flag. However, our numbers differ from theirs: 39 in 2010, 31 in 2011, and 25 in 2012. Note that tracking this specific statistic is very difficult for any VDB. I can say with certainty that we have not flagged all of the vulnerabilities that fit this bill, but we have made a considerable effort to do so based on the information available.
Several reports including Symantec, IBM / ISS X-Force, and others have recently started highlighting statistics surrounding the vulnerabilities in web browsers. This probably seems simple to most people, even many security professionals. I can assure you, that is not the case. As a recent example, Carsten Eiram of Risk Based Security (a sponsor of OSF / OSVDB) has spent the last three months doing extensive analysis and reworking of WebKit vulnerabilities. WebKit serves as the central rendering engine for several browsers including Google Chrome, Apple Safari, RIM / BlackBerry, and soon Opera. This generally means that any vulnerability in WebKit will likely affect the four browsers mentioned, and more. In the real world, due to vendors not playing well with others, we see Apple release vague vulnerabilities attributed to WebKit months after Google Chrome does the same. Carsten’s digging and analysis has found a considerable amount of duplicate CVE assignments as a result. In addition, he has found many additional vulnerabilities that were either silently patched by vendors, or remain unpatched currently, simply by using the same resources as the developers. With this in mind, the Symantec statistics are more revealing:
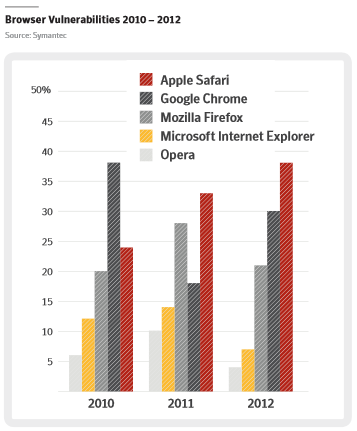
In 2012, they show 38 Apple Safari, 30 Google Chrome, 21 Mozilla Firefox, 7 Microsoft IE, and 4 Opera vulnerabilities. Given that OSVDB has cataloged 219 vulnerabilities in WebKit in 2012 alone, that means the Symantec statistics are worthless. Those 219 vulnerabilities largely affect both Chrome and Safari, as well as other browsers. Even if we switch to look at vulnerabilities specific to Google Chrome we see 221, and for Apple Safari we see 66 distinct vulnerabilities. This kind of oversight in browser statistics is, for lack of better words, amateur hour.
[Update 6/7/2013 – As pointed out in a comment below, I misread this as # of vulns rather than percentage. I am leaving the paragraph above in full for posterity. However, please note that all of my comments would also affect their percentages as well. I certainly screwed this part up, but their stats are still wrong. =)]
Another hot topic the last two years are vulnerabilities in SCADA (Supervisory Control and Data Acquisition) systems. These are the systems that run vital parts of the world’s infrastructure, including electric, gas, sewage, and more. According to the Symantec report:
In 2012, there were 85 public SCADA (Supervisory Control and Data Acquisition) vulnerabilities, a massive decrease over the 129 vulnerabilities in 2011.
These statistics, if used for any guidance in SCADA facilities, should be criminal. OSVDB cataloged 167 SCADA vulnerabilities in 2011, and saw it jump to 211 in 2012. We’ve already cataloged 66 SCADA vulnerabilities in 2013, due to increased diligence in monitoring SCADA vendors for reports that may not make their way to ICS-CERT.
Toward the end of the report, in their “Looking Ahead” section, they give some general predictions of what is to come. “More State-sponsored Cyber Attacks”, “Social Media Will Be a Major Security Battleground”, “Sophisticated Attack Techniques Trickle Down”, “Attacks Against Cloud Providers Will Increase”, “Websites Will Become More Dangerous”, and “Increasingly Vicious Malware”. These are hardly ground-breaking or interesting, as they have all been the status quo for many years. What I find interesting is that the statistics they offer show a drop in vulnerabilities, both overall and in specific sectors such as SCADA. Symantec’s numbers don’t support their predictions very well.
I think it is fair to say that Symantec has lost sight of the real value of such reports. Instead, I envision Symantec planning meetings about the graphics, presentation style, and narrative they’re presenting. Vulnerability statistics are not easy; in fact, they are exceedingly difficult to get right. You would think that a company with the resources and longevity of Symantec could figure that out. Unfortunately, the report has become the focus, not the reliable data that should drive it.
Leave a Reply