[This was originally my proposed introduction for Flashpoint’s 2026 Global Threat Intelligence Report. Due to the style of the report and covering a lot more intelligence sectors than vulnerabilities, only pieces of this were used. So I am publishing the entire original draft here for posterity.]
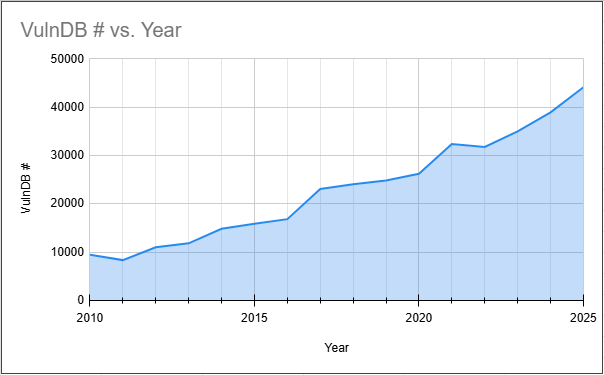
The fact that there were over 48,000 CVEs published last year, while VulnDB tracked 44,146 vulnerabilities in that time is quite telling. VulnDB maintains 100% CVE coverage, and additionally covers over 116 thousand more that do not have CVE IDs. That means, to us, there were at least 4,000 CVEs assigned this year that do not represent distinct vulnerabilities. There are three primary factors for this.
First, there were 48,175 CVEs published in 2025, but that does not correspond to that many vulnerabilities being disclosed in 2025. MITRE has still not implemented a rule that dictates a CVE ID’s prefix must correspond to the disclosure year. Since MITRE nor the National Vulnerability Database (NVD) actually track disclosure dates, there is simply no way to use that dataset to determine the actual growth in vulnerability disclosures year over year.
Second, each vulnerability database may abstract differently. Meaning, that the same vulnerability disclosure could be interpreted differently by different people. MITRE, which has no abstraction policy, is at the mercy of the CVE Numbering Authority (CNA) or researcher to determine abstraction. One person may view the disclosure as a single vulnerability, while the next views it as two vulnerabilities, and a third may deem it to be a duplicate to a prior disclosure. VulnDB has an abstraction policy and it is consistently followed.
Third, on the topic of duplicates, this has become an increasing problem the last two years where researchers are “farming” CVEs. By requesting CVE IDs and understanding there is no scrutiny, and no quality assurance (QA) in place at MITRE, it is trivial to get multiple CVE IDs for the exact same vulnerability. This tends to happen in two major areas.
The first is hobby PHP software that will likely never be used by any business. That same piece of software is forked by the author, minor changes made, re-skinned to appear differently to suit a different purpose yet it is 99% identical code. Just like you see one CVE for a vulnerability in Windows (multiple versions), this is essentially no different. Yet, researchers can request a new CVE ID for each version of that same software.
The second is in home routers by D-Link, Netgear, TP-Link, Tenda, and ASUS among others. Variations in how the research is performed can lead to one disclosure using pseudo-functions, another using a parameter only, while a third might use an endpoint and actual function. These make it tricky to spot duplicates, even for seasoned analysts. Meanwhile, no part of the CVE ecosystem applies any scrutiny or QA to catch these.
Another factor that must be considered is if a number like 48,175 includes CVE IDs that have been REJECTED or not. Once placed in that state, they are technically “published” and could be factored in depending on who does the analysis. Yet another consideration is that while there may be a lot of disclosures in a given year, you must note how many do not represent an actual vulnerability. A surprising number of disclosures are actually stability bugs, not vulnerabilities, or they are issues that do not cross privilege boundaries and therefore are not vulnerabilities either. In 2025 alone, VulnDB tracked 311 disclosures that were deemed “not a vulnerability” (NAV).
These are just a few examples of considerations that must be made when dealing with vulnerability statistics, and should be disclaimed on any report published. Without such caveats readers should be hesitant to use them in making any decisions about your organization’s methodology and triage efforts.

The past five years have seen a few key events that have disproportionate impacts on the growth of CVE. Perhaps the most pivotal year for CVE and disclosure growth was 2021. In June, Wordfence and Patchstack were both minted as CNAs. The resulting volume from Patchstack alone was noticeable as we saw a jump in vulnerabilities from 26,235 in 2020 to 32,365 (+6130) in 2021 alone. At the end of 2021, VulDB (not to be confused with Flashpoint’s VulnDB) was minted as a CNA. They were not as fast to get their processes in order so the impact wasn’t immediate. However, VulDB ended up being the second highest for volume in 2025, behind Patchstack.
The other big impact was when the Linux Kernel team was minted as a CNA in February, 2024. Since then their output has been considerable, often going dormant for days or weeks at a time before publishing large batches of CVE IDs. The Kernel team’s stated policy for publication makes it clear that they know, for a fact, that not all of their CVE IDs will represent actual vulnerabilities. Rather, they are assigning them because “any bug could be a security bug”. Their volume of CVE publication last year put them as the third highest for the year.
Despite the growth, which was the big topic after the new year, it is important to look at these numbers in a historical context. The increase from 2020 to 2021 was considerable, with a jump of over 6,000 is certainly noteworthy and it too caused the same level of shock as the end of 2025. However, looking at the change from 2021 – 2022, just a year after, we saw a decrease of 591. So not only was there no growth, which everyone expected, there was a slight decrease. That is the second time since 2010 we have seen a decrease year-to-year instead of the expected increase.
All of the statistics and numbers around vulnerabilities can certainly be interesting and they can tell a story. But it is critical that those numbers and stories be viewed in a broader context with clear definitions around each term. A CVE ID isn’t a singular vulnerability usually, and a CVE ID prefix does not necessarily correspond to the year a vulnerability was disclosed. Conflating “CVE” to mean “vulnerability” is not accurate and can lead to misunderstanding of what the landscape really looks like.