
Last week, a colleague shared a link to the “Zero Day Clock“, a web site that has a substantial number of signatories, including some big names. I want to talk extensively about the clock because it makes at least one significant mistake and points out what the data means along with a comparison to another dataset, and then a bit about a few signatories. Yes, I will be calling a couple people out by name so grab the popcorn. Before I start, I want to be very clear that I like the idea of this project. So most of this blog is about giving feedback and suggesting improvements.
All The Problems
The name of this project, “Zero Day Clock – All The Problems Matter” is where the title of the blog comes from, just dropping one word to make it clear. To me, that phrase is best attributed to The Wire and the “all the pieces matter” concept. Perhaps that isn’t where they found inspiration but it certainly is a part of the vulnerability disclosure ecosystem. When you think about it, a vulnerability being exploited is just a piece of metadata around it. That, along with so many other pieces of metadata build the bigger picture to inform risk decisions. We’ll just gloss over the irony of their tagline, “all the problems matter” when they highlight a tiny fraction of the overall vulnerabilities / problems.

The gist of this project is, as quoted from the sub-heading of the first table: “TTE (Time-to-Exploit) measures the gap between CVE disclosure and confirmed exploitation.” On the surface this seems straight-forward but it actually devolves quickly and it isn’t easy to notice for many people including some colleagues in the security industry. Under that one-line explanation, there is a legend explaining the chart:
- Mean TTE (10% trimmed, days)
- Median TTE (days)
- Weaponized Exploits (count)
Fortunately, the project cites their sources which is great to see: “Based on 3,515 CVE-exploit pairs from trusted sources (CISA KEV, VulnCheck KEV & XDB)”. As many of us know, the Cybersecurity & Infrastructure Security Agency (CISA) maintains a Known Exploited Vulnerability catalog. However, very few understand how small it is compared to real-world exploitation. That’s why it is good to see them using VulnCheck’s KEV, which to the best of my knowledge is the largest source of free KEV intelligence. I emphasize free because if you are willing to pay, you can get considerably more from Flashpoint’s VulnDB (the database I work on).
Houston, We Have a Major Problem
So again, from the first table on the main page, we get the definition of TTE as “measures the gap between CVE disclosure and confirmed exploitation”. But if we look on the Signatories page, where all the details and disclaimers are (?!), we see the definition of TTE as “measures the elapsed time between when a vulnerability is publicly disclosed and when a confirmed exploit becomes available.” See the difference?
- TTE = CVE disclosure -> confirmed exploitation
- TTE = Public disclosure -> exploit available
Which is it? Those are very different things and produce very different results. That is one definition that is mixing up four different dates. You cannot defend that “confirmed exploitation” and “exploit available” are the same thing, at all. You can try to defend that “CVE disclosure” and “public disclosure” are the same, but you would be wrong due to conflating two separate events as one. This happens way too frequently for those that live exclusively in the myopic CVE ecosystem. More on this below.

Back To It
OK, let’s begin with the term “weaponized exploits”, because what does that actually mean? Companies throw this term around because it sounds cool, yet it means different things to different people. The closest we get to a definition from this project is a disclaimer that “PoC vs weaponized: A GitHub proof-of-concept is not the same as a weaponized exploit. PoCs are tracked in the Explorer but excluded from the TTE computation.” which still doesn’t explain the term. Is it exploit code that is functional? Or is it exploit code that is not only functional, but highly reliable and works against different configurations and architectures? Or does it mean the exploit has been weaponized in attacks in the wild, thus KEV? All of these definitions have been used by security companies in the past decade or more on top of researchers frequently conflating proof-of-concept (PoC) with a working exploit. Zero Day Clock needs to clearly define these terms.
Next, this project has a considerable amount of bias because in 2018 (the starting year), almost no one was tracking KEV data. CISA’s KEV didn’t start until October, 2022. VulnCheck wasn’t founded until 2021. In reality, KEV obviously goes back a long, long time. 1902 to be exact if you want to get pedantic! Here’s a powerpoint slide deck from a presentation I gave on the history of vulnerabilities, which begins with a story from that year and a real-world, live zero-day hack. So it’s curious to me why they picked 2018 other than it’s probably the first year they had significant enough data.
Why was KEV not tracked back then? Well, it was, just not by many folks and not formally called a “KEV”. VulnDB had been tracking exploitation for many years before that but we didn’t have a classification for “Exploited in the Wild”. Instead, KEV functionality was done via keyword notation of threat actors and campaigns known to have used them. That, along with me looking at more historical data is why our KEV is larger than VulnCheck or CISA. A lot of that data isn’t directly helpful or relevant to defenders, it’s more to capture the historical and anthropological aspects of such exploitation.
Further, while the early days of Intrusion Detection / Prevention (IDS/IPS) created signatures based on specific CVE IDs, that went away fairly quickly. Instead, signatures were created to be more generic as they would catch more exploitation attempts, more variations on a given exploit, and might hopefully detect or block a zero-day attack. That means we had over 15 years of data that wasn’t tied directly to a CVE and required extensive analysis to go back and match after the fact. So this project is comparing two very different things, creating what seems to be a scary trend based on data presented, where only half the picture is painted.
Claiming there is a drop from 2.3 years to only 1.6 days in eight years is staggering. But I don’t think this paints an accurate picture and doesn’t provide enough prominent disclaimers. They cite their sources but you have to look at another place that isn’t obvious, the ‘Signatories‘ page, to find a critical piece of information. Below all the names and quotes you get additional information that is important to understand. The one I was after is this: “The current dataset contains 3,513 CVE-exploit pairs from these three sources.” So this trend is based on 3,513 “CVE-exploit” pairs. Well shit, here we go…
- 3,513 out of how many?
- Does it contain any non-CVE KEV?
- Does it speak to cases where one CVE is assigned to multiple distinct vulnerabilities?
- One CVE-exploit pair means one entry in data?
- One CVE-exploit pair could mean two or more entries?
That’s a few questions but they are critical to understanding this data and what that initial chart actually means. We understand why the 2018 to 2022 data is so skewed already, but what about the rest? Another thing that is obvious on the surface, to some people, is what “Time To Exploit” really means. Sure, in the context of KEV it is obvious but historically there are some that used this to mean “time to exploit publication”, rather than “exploitation in the wild”. This is rather pedantic, I know, but why not use “time-to-KEV” (TTK) since that term has become more well-known? This is where VulnDB originally used TTE for “exploit publication” in its Vulnerability Timeline and Exposure Metrics (VTEM) long before “KEV” was the term and tracking the date was done.
Another big elephant in the room is the over-reliance on CVE data which is woefully incomplete, and introduces obvious problems in data like this. Recall the explanation at the top: “gap between CVE disclosure and confirmed exploitation”. So they are working with inaccurate dates in this context, and that is one of two pieces of data used to generate this. Meaning, literally half their input data is often incorrect. Yes, that’s a sad reality that many overlook historically too. CVE does not capture the actual disclosure date.
Hell, even the CVE ID prefix is not necessarily the year the vulnerability was disclosed. That goes back to 1999 even, when the project opted not to create IDs that matched the year for vulnerabilities disclosed prior to 1999. For example, CVE-1999-0145 covers a vulnerability in Sendmail that was disclosed in 1983. You will notice that year doesn’t appear in the CVE entry anywhere. You can look at the JSON for it and see that they don’t track the actual disclosure date of vulnerabilities. NVD does not capture it either. In short, CVE data simply cannot be used for any form of vulnerability timelines unless you are specifically talking the time between “CVE Disclosure” and another attribute. But given CVE can assign or open a RESERVED ID as long as ten years after disclosure, you’ve been warned.
I asked someone at VulnCheck who confirmed that Zero Day Clock is not using their commercial data, which does include the actual disclosure date for some / most / all of their KEV. If this project used either VulnCheck (commercial) or Flashpoint VulnDB (commercial) to calculate, we would get a much better picture of the TTE trends. Flashpoint tracks eight dates in a vulnerability timeline including the actual disclosure date, exploit publication date, and first known KEV date. That is what is needed to better understand KEV data, and the chart would reflect the gaps between each of those dates.
This is also where CISA’s KEV could improve. We know the date a vulnerability was added to the KEV, but not the first date of exploitation. That is a piece of information they will know for some entries, or at least a more accurate date than KEV publication date. It’s something that benefits defenders and does not assist attackers. To me, there is no reason for withholding that data from us, especially as taxpayers funding their efforts.
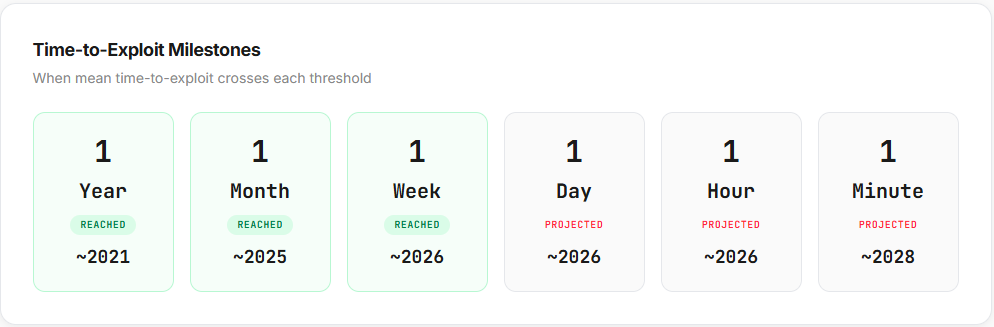
The chart, using known bad data, is what influences us. That visual is stark and eye-opening, and it also leads to predictions like above. Will we really see a one minute average in 2028? I can understand that prediction based solely on the chart, but if we know that data is skewed heavily toward the earlier years, and using inaccurate disclosure dates, can they really predict that? In reality, the wildcard in all of this is the use of large-language models (LLMs) to perform exploit development. As that improves and functional exploits are easier to write, potentially reducing the time to create complex exploits in a significant manner, that could be the game changer. Historically, some high-end but extremely potent exploits could take weeks for someone to create.
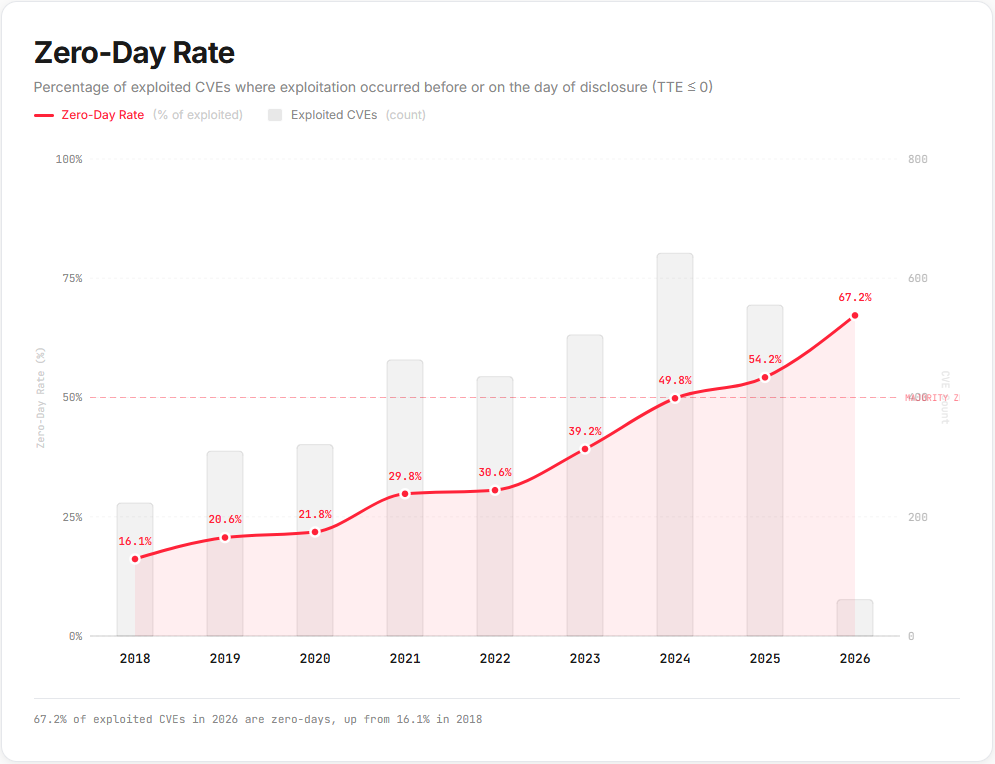
And this folks, is where we part ways significantly. I personally think that this chart shows more of a data skew than anything else, but it is near impossible to prove without access to their raw data. In comparing numbers, this project is showing an incredible number of zero days higher than I see in VulnDB (e.g. ZDC says 320 for 2024, VulnDB says 89), and even a bit more KEV in 2025 and 2026. As of yesterday, VulnDB had 1,533 zero-days and 6,810 KEV versus CISA’s KEV at 1,536, EUVD’s KEV at 1,547, and VulnCheck’s KEV at 4,621.
It’s difficult for me to understand how we could have that many more KEV than them, yet less this year and last. VulnCheck and VulnDB use similar methodologies from what I have ascertained and numbers will fluctuate some. I also know from a brief audit of VulnCheck’s KEV I performed at one point, there were many dozens that should not have been included and were likely the result of automation. I brought those to the attention of VulnCheck and hopefully they were resolved and the methodology slip-up addressed.


So looking at these numbers, on the surface it appears that this project has more zero-days and KEV in some years, while less than others. But, if you aren’t tracking dates accurately it trivially introduces bias that can flag something as a zero-day that is not. So these numbers are heavily skewed, in my opinion, because I know the methodology VulnDB uses, and I know the shortcomings of this project’s data. While I am not saying our numbers are absolutely correct, I think they are considerably more accurate. To give an example of how this might manifest, let’s look at a fictional vulnerability and two timelines that might be associated with it, and the results.

This image shows how tracking dates properly becomes critical in identifying if a vulnerability is a zero-day or not. Since we have been tracking extended timelines for two decades, I can assure you instances like this happen frequently. Then add in that VulnCheck XDB is hyper-focused on exploit metadata and may have some ‘exploit publish’ dates before ours, while we focus on a much broader set of metadata including over 100,000 vulnerabilities without a CVE. Where we both fall short I believe, is tracking foreign sources, especially Chinese. I cannot count the times that we had an exploit publish date, and then days/weeks/months/years later while going through a Chinese researcher’s blog, I’d find an exploit for the vulnerability. Speaking of which, over 800 of those are KEV and do not have a CVE ID. So two things to consider here:
- Better Data Matters
- Different data sets produce different results
With that in mind, I will once again remind people consuming the Zero Day Clock site to please read some of the disclaimers and details about their data. This is important context that better explains their results. As I am fond of pointing out, if vulnerability statistics don’t come with disclaimers, you should be asking the publisher pointed questions.
Signatories
This page is both great and amusing. These are people that have signed off on the site’s Call to Action. A quick skim and you think “yeah, all of these people are in the vulnerability game!” Then look closer and there’s two people that stand out. First, Bruce Schneier who is a raging cluebag in the big picture. He has not, however, and does not work with vulnerability data. He has never run a vulnerability database. He has long been a pundit, and at some point I will share a story or three about him that would, in my mind, make him eligible for Attrition’s Charlatan section. Regarding the “Call to Action” and bullet five, speaking to open-sourcing the defense? You first! Share all the raw data used to generate this site please. Fair is fair.
Attacks always get better. They never get worse. But for the first time, the same is true for defense. The race just got faster on both sides — and the side that sees the data first wins. – Bruce Schneier (Yappy Pundit, Idea Thief)
Yes, I gave him a new title based on my personal experience with and my opinions of him, as well as many stories told to me about him. His quote shows he doesn’t understand this at all. “But for the first time, the same is true for defense”? Why exactly is that Mr. Elitist Security Legend? Nothing about this data tips the advantage to the defense. Further, in theory you can say the first to see the data wins, but that too is wrong. A blue team can hear about a zero-day, yet not know any concrete details about it, and still not have any advantage. Meanwhile, exploit developers can more swiftly target the vulnerable software even if they have no idea where the vulnerability lies, and have a better chance of finding it over the defense patching against it. This is the simple reality, one that you don’t live in. So please, fuck right off to your pretend ivory tower.
I built DEF CON so researchers could show what they found. For thirty years, I watched the time between finding a vulnerability and exploiting it get shorter. We’re running out of timeline to show. – Jeff Moss (Black Hat & DEF CON)
Speaking of someone else who hasn’t done any of the in-the-weeds vulnerability work, what does the last line mean? We aren’t “running out of timeline“. A timeline is a series of dates that show the chronological order of events related to something. The times between dates may be shortening, which is the point of the site. But we aren’t running out of dates to show. What you should be advocating for is increasing the timeline that is tracked. Call for MITRE/CVD and NIST/NVD to start actually tracking this data that matters.
Additionally, when did DEF CON add a dedicated track for blue team talks? Never. When did DEF CON spin up a Blue Team Village? Jeff didn’t. A separate group of folks proposed it, built it, and ran it starting in 2018, twenty-four years after DEF CON started. Moss had the ability to help better provide avenues into blue teaming, provide information for defenders, and give a more prominent voice to the importance of defense. He did not. Instead, he fully encouraged talks to be around dropping zero-days, literally working against defense. Until next time Jeff, go buy a personality and some integrity with that fat DEF CON cash.
Neither of these people run a security company that deals with offense and defense, or works in the vulnerability space, in the same manner as the rest of the signatories. One is a glorified pundit that has a lot of eyes, but always a day or three late to a story because he is just a watered down journalist. The other ran a conference that became incredibly popular, yet also one that has harbored abusers and has embraced an atmosphere where the volunteer security staff are frequently called out as the problem they are there to prevent from happening. Getting “big” names to sign on may look good to some, but it detracts to others that have observed them a lot longer.
P.S. Thanks to Sioda for providing feedback and suggestions!