


This is part two of my thoughts on Known Exploited Vulnerabilities (KEV), and where it gets a lot more interesting! Please see the first blog before starting here.
Automation / Eagerness To Add
Reading vulnerability disclosures can be a grueling mission full of frustrations. Poorly written advisories, missing technical details, and errors make the life of a disclosure analyst exhausting (Want to improve your disclosures?). Generally, threat actor reports tend to be better-written as they demand both a depth of knowledge and communication skills. Some companies rely on automation to help with varying degrees of tasks, and the desire and promise to automate more is always there. In some cases, automation and possibly a bit over-eagerness to add vulnerabilities to a KEV catalog is there too.
Recently I was asked why a specific vulnerability (CVE-2018-1000600) appeared in a KEV list and went down a bit of a rabbit hole figuring it out. The original source of information cited was from a F5 blog on CVE-2017-9841 scanning activity. That blog mentions the titled CVE and two others. However, none of the three was the CVE in question. At the bottom of the blog it has “Footnotes” and lists over 100 CVE IDs. This led me to re-read the blog to see if there was a more casual mention that refers to them and nothing stood out.
Another aspect of the blog that stood out was a table of various endpoints that it is common to see the eval-stdin.php script. Knowing that some third-party software that gets integrated will be done in a way that alters paths. So it is common to see e.g. FCKeditor and similar components used frequently but not accessible via the same endpoint. That led me to search for the script name and realized this wasn’t such a case.
What’s left? Reach out to the source of the information! I sent a Tweet to the blog’s author and asked what the footnotes represent exactly. I received a quick reply from Malcolm Heath that the long list of CVE IDs “are all the CVEs we have observed being scanned for in the series.” Ah, so fair game for a KEV catalog, right? Unfortunately, no, it comes with an important point.

“Most appear every month and most of them are obviously attempts at exploitation (one-request RCEs, etc.), some are recon/identification.” That is an important caveat because it means that we simply don’t know, via this source at least, which are actually exploited and which are just scanned for. That isn’t enough information to land a vulnerability on a KEV list. Going back to where it appeared in a KEV it made me wonder if this was a case of automation pulling in them since they are “footnotes”, which can imply they are related to the activity in the blog. Otherwise, was this a case of making an assumption and just being eager to drive the KEV number up?
Either way, it is a reminder that we must be diligent when adding a vulnerability to a KEV catalog. We all make mistakes including momentary lapses of reading comprehension, automation gone awry, or that almost gamified element of running an intelligence service that has metrics that are used in marketing. We have 1,000 widgets or 3 Yottabytes of data! Personally, I am definitely guilty of wanting to see those numbers driven higher as it represents work and dedication to completeness.
Past Data
While the notion of maintaining a KEV list is a relatively recent initiative, there is prior art in trying to capture such data or (wildly) estimate numbers. While this is by no means an exhaustive effort to catalog such statistics, even in a given time period, it should demonstrate some pitfalls in trying to make claims around known exploited vulnerabilities, and more importantly, how headlines and presentation matters. I’ve highlighted the percent exploited for easier reading, but it is important to read the time frame and total CVE IDs being used to derive that number, along with any footnote I have provided for more context and clarity.
Total vulns vs # known exploited, is it really that small?
| Date | Article | Source | Time Frame | Total CVEs | Exploited | Ex % |
| 2024-08-06 | Infosecurity Magazine | Qualys | Q1/Q2+ 2024 | 22,254 | 204 | 0.91% |
| 2023-12-19 | SCMagazine | Qualys | 2023 | 206 [10] | 103 | 50% |
| 2023-11-02 | ReliaQuest Blog | ReliaQuest | Q2/3 2023 | 14,000+ [9] | 133 | 0.9% |
| 2023-10-01 | EPSS Model | FIRST | Oct 1 – 30 | 139,473 | 3,852 | 2.7% |
| 2023-06-15 | Enhancing Vulnerability Prioritization | Jay Jacobs et al. | July, 2016 – December 2022 | 192,035 | 12,243 | 6.4% |
| 2023-04-02 | Resilient Cyber | Qualys | 2022 | 25,228 | 134-207 [3] | 0.5-0.8% |
| 2023-02-28 | SecurityWeek | Rapid7 | 2022 | 28 | 16 | 56% [6] |
| 2022-11-04 | RedHat | RedHat | 2021 | 1,596 | 26 [8] | 1.6% |
| 2021-11-03 | BOD 22-01 | CISA | < Nov 3, 2021 | 187,790 | 7,512 [2] | 4% |
| 2021-02-19 | TechRadar | Kenna | 2019 | 18,000 | 473 [1] | 2.6% |
| 2020-12-14 | SecurityWeek | Kenna | 2020 | 17,913 | 2,836 [7] | 2.1-15.8% [7] |
| 2019-06-04 | ZDNet | Jay Jacobs et al. | 2009 – 2018 | 76,000 | 4,183 | 5.5% |
| 2019 [4] | Prioritization .. Volume 1 | Kenna | 2009 – 2019 | 108,314 | 2,166 [5] | 2% |
As always, no vulnerability statistics should come without solid explanation and/or caveats, and even this summary comes with quite a few. You can find them at the end of the blog. Additionally, there are articles and marketing puff pieces that use similar wording but have very different meanings, and their conclusions and numbers are dubious at best. Consider the following headlines and what they really mean, or what can be interpreted from them.
- Rezilion: “85% of Vulnerabilities Pose No Risk.” [404] – So only 15% pose a risk? If we use the NVD Dashboard to get rough numbers on criticality, then 9% of those 15% (3,539) would be critical risk under CVSSv3 scoring, and 22% of those 15% (8,651) would be at high risk under CVSSv2 scoring.
- Dark Reading: “Only 3% of Open Source Software Bugs Are Actually Attackable, Researchers Say” – That is a bold statement when you simply can’t speak to how organizations implement open source software. This headline also doesn’t speak to an important caveat; “Data from the report shows that developers saw a 97% reduction in false-positive library upgrade tickets once they considered attackability when examining packages in use with critically rated vulnerabilities.” The bold is mine, to emphasize that now we’re looking at a much smaller subset of vulnerabilities and we still don’t know by what scoring standards.
Mend: “Our research shows that only 15% to 30% of vulnerabilities are indeed effective” – First, that is a big range and represents a big jump if they are incorrect about 15% and correct about 30%. Second, this seems to contradict the prior Dark Reading article by a minimum of 500%. - Datadog: “Only 3 percent of critical vulnerabilities are worth prioritizing.” – Can we really believe that 97% of critical vulnerabilities are not worth prioritizing (presented as a “Fact” too!)? Perhaps in the big picture, given your organization doesn’t run a lot of the software with critical vulnerabilities reported. The more baffling part follows this where they say “… and whether the hosting service has been actively targeted by any attacks—makes a big difference in determining next steps for remediation.” What hosting provider hasn’t been targeted in attacks?
Is It Even a KEV?
Here’s what should be a relatively straight-forward question! Is CVE-2015-2551 a known exploited vulnerability? You can see it was REJECTed by MITRE, the CNA, for not being used in 2015 so that’s an easy “no, it is not KEV“. Or is it? According to multiple companies that track Ransomware, they say it is associated with 17 groups. Yet they cannot even say what vendor or product is affected.
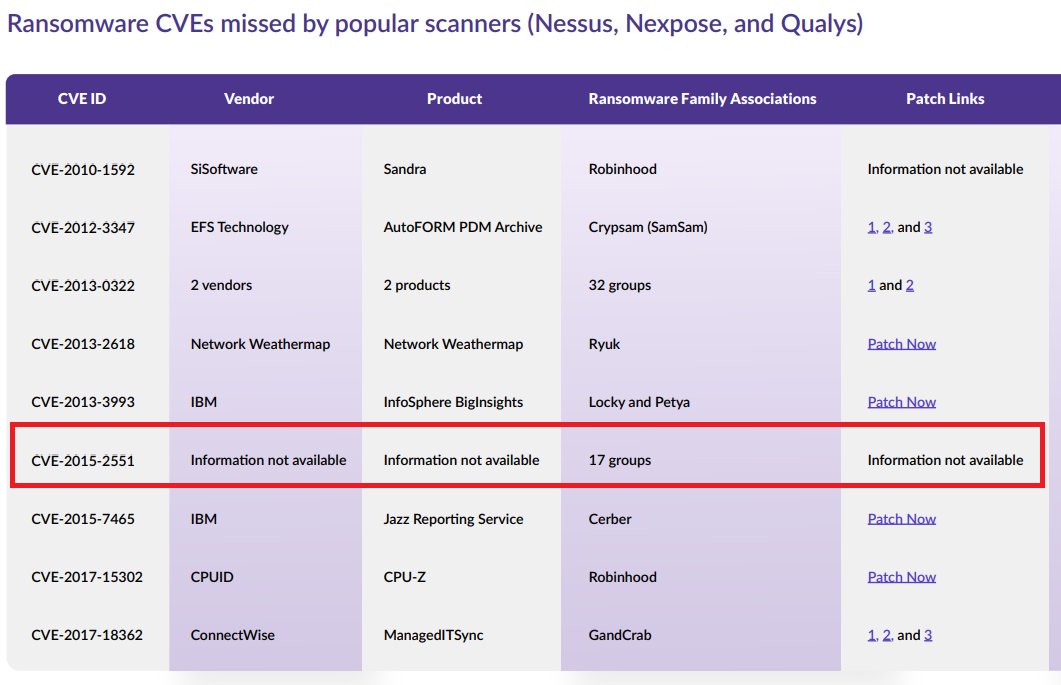
When four different companies were asked for provenance of the ransomware information, none replied. One person found a reference from McAfee suggesting it is a remote code execution vulnerability in Oracle Java. I plan to blog further on this specific CVE and one other after more sleuthing in the future.
Moving Forward
Where to from here? Hopefully it is clear that maintaining a KEV catalog is not always straight-forward and has its share of challenges. I don’t like just complaining and not offering solutions, but there aren’t readily available fixes to some of the problems. That said, there are a few general thoughts on improving the KEV landscape.
- CISA should publish a second list of vulnerabilities under investigation so organizations can use it as a secondary list for risk and triage. Easily disclaimed as such, federal stakeholders don’t need to jump to fixing, but it gives them a better opportunity to intelligently patch. If one vulnerability affecting a product is newly added to a KEV catalog, and two more are on the investigation list, it is easier and more efficient to patch all of them to be safe.
- Vendors sharing KEV information, please do not say “detected exploitation in January“. When exactly was it detected? January a 31 day spread and worse, reports that just indicate it was exploited sometime in the prior year. Give us the first precise date you are aware of and just disclaim it could be earlier.
- If you claim a vulnerability was seen being exploited in the wild, be ready to at least confirm you have the right CVE if asked or challenged. The number of CVE typos in reports is > 0 which is problematic. Further, if you say something is a KEV and there is no supporting evidence and red flags about the accuracy, be ready to provide just enough supporting evidence to back the claim.
In general, if you publish KEV data, think about the greater good. Accuracy is definitely key, as well as timeliness. It’s hard to guess how many organizations rely on your data, but in some cases like CISA, it is considerable. There’s a reason they have such high standards for including a vulnerability in their KEV list. Figure out that good balance in reporting and serve the broader ecosystem as best you can.
Thank you for coming to my KEV talk!
Footnotes
[1] “A mere 6% of those 473 vulnerabilities ever reached widespread exploitation by more than 1/100 organizations,” Kenna Security’s report read. “The fact that an exploit is ‘in the wild’ does not mean it’s a raging hog wild across the internet. There is no ‘typical’ vulnerability lifecycle. Only 16% of the CVEs we studied followed the most common sequence of Reserved-Patched-Scanned-Published-Exploited. Several key milestones tend to converge surrounding CVE publication.”
[2] 187,790 derived from all vulnerabilities with a CVE until BOD 22-01 publication date. Walter Haydock notes that this may be a misrepresentation of a Carnegie Mellon study.
[3] Because of the way Qualys shows numbers in ‘buckets’ like Malware, Threat Actor, and ‘Ransomware’, there is no way to know what overlaps with the ‘CISA KEV’ bucket.
[4] Always include a publication date.
[5] Note that the report says “Only 5% of all CVEs are both observed within organizations AND known to be exploited.” which is not a statistics around exploited in the wild, as they define ‘observed’ to mean during penetration testing and more. The Key Findings page says “2% of published vulnerabilities have observed exploits in the wild.”
[6] The actual numbers that generated the 56% vs the wording around it are potentially misleading. “Attackers are still developing and deploying exploits faster than ever. 56% of the vulnerabilities in this report were exploited within seven days of public disclosure — a 12% rise over 2021 and an 87% rise over 2020.“
[7] OK stick with me here, let’s try to break down what this “simple” statistic really means. Their line boils down to “in 2022, 2.1% of critical vulnerabilities have been exploited“. If we begin by assuming they mean vulnerabilities with a CVE, and we go with CVSSv2 9.1 – 10, for all vulnerabilities in 2022 up to 2020-12-14 when the associated news article was published, that is 2,836 vulnerabilities. In that same time period, there were a total of 17,913 vulnerabilities assigned a CVE ID, meaning Kenna’s number should be 15.8%. Slight difference between 2.1 and 15.8 obviously, so it isn’t immediately clear what the real number is. Or perhaps this is confusing grammar and the “or” refers to “vulnerabilities disclosed this year” rather than “critical” ones?
[8] Note that this analysis was based on “vulnerabilities affecting the Red Hat product portfolio“.
[9] The report says “over 14,000” vulnerabilities were disclosed in this period, but does not provide a more precise report. Using 14,001 and 14,999 gives us the percentage range that is actually 0.95% to 0.89%, but to three digits each rounds up to 0.9%.
[10] “25 percent of these security vulnerabilities were immediately targeted for exploitation” and “Of the 206 high-risk vulnerabilities we tracked, more than 50 percent were leveraged by threat actors, ransomware, or malware to compromise systems” give us two perspectives of this data.