
[This was originally published on the OSVDB blog.]
I’ve written about the various problems with generating vulnerability statistics in the past. There are countless factors that contribute to, or skew vulnerability stats. This is an ongoing problem for many reasons. First, important numbers are thrown around in the media and taken as gospel, creating varying degrees of bias in administrators and owners. Second, these stats are rarely explained to show how they were derived. In short, no one shows their work, shows potential bias, caveats, or other issues that should be included as a responsible security professional. A recent article has highlighted this problem again. To better show why vulnerability stats are messy, but important, I will show you how it is trivial to skew numbers simply by using different criteria, along with several pitfalls that must be factored into any set of stats you generate. The fun part is that the word used to describe the differences can be equally nebulous and they are all valid, if properly disclaimed!
I noticed a Tweet from SC Magazine about an article titled “The ghosts of Microsoft: Patch, present and future”. The article is by Alex Horan, security strategist, CORE Security and discusses Microsoft’s vulnerabilities this year. Reading down, the first line of the second paragraph immediately struck me as being incorrect.
Based on my count, there were 83 vulnerabilities announced by Microsoft over the past year. This averages out to a little more than six per month, a reasonable number of patches (and reboots) to apply to your systems over the course of a year.
It is difficult to tell if Horan means “vulnerabilities” or “patches”, as he appears to use the same word to mean both, when they are quite different. The use of ’83’ makes it very clear, Horan is referencing Microsoft advisories, not vulnerabilities. This is an important distinction as a single advisory can contain multiple vulnerabilities.
A cursory look at the data in OSVDB showed there were closer to 170 vulnerabilities verified by Microsoft in 2012. Doing a search to include references for “MS12” (used in their advisory designation), 160 results. This is how it was easy to determine the number Horan used was inaccurate, or his wording was. If you generate statistics based on advisories versus independent vulnerabilities, results will vary greatly. To add a third perspective, we must also consider the total number of disclosed vulnerabilities in Microsoft products. This means ones that did not correspond to a Microsoft advisory (e.g. perhaps a KB only), did not receive a CVE designation, or were missed completely by the company. On Twitter, Space Rogue (@spacerog) asked about severity breakdowns over the last few years. Since that would take considerable time to generate, I am going to stay focused on 2012 as it demonstrates the issues. Hopefully this will give him a few numbers though!
If we look at the 2012 Microsoft advisories versus 2012 Microsoft CVE versus 2012 Microsoft total vulnerabilities, and do a percentage breakdown by severity, you can see heavy bias. We will use the following breakdown of CVSS scores to determine severity: 9 – 10 = critical, 7 – 8.9 = important, 4 – 6.9 = moderate, 0 – 3.9 = low.
| Base Source | Critical | Important | Moderate | Low |
| 2012 Advisories (83) | 35 (42.2%) | 46 (55.4%) | 2 (2.4%) | — |
| 2012 CVE (160) | 100 (62.5%) | 18 (11.3%) | 39 (24.4%) | 3 (1.8%) |
| 2012 Total (176) | 101 (57.4%) | 19 (10.8%) | 41 (23.3%) | 15 (8.5%) |
It isn’t easy to see the big shifts in totals in a chart, but it is important to establish the numbers involved when displaying any type of chart or visual representation. If we look at those three breakdowns using simple pie charts, the shifts become much more apparent:
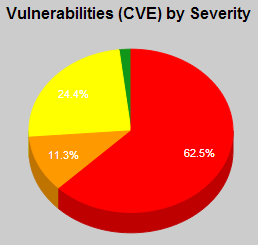
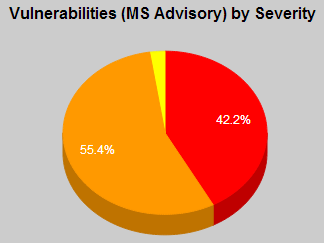

The visual jump in critical vulnerabilities from the first to the second two charts is distinct. In addition, notice the jump from the first two charts to the third in regards to the low severity vulnerabilities and that they didn’t even make an appearance on the first chart. This is a simple example of how the “same” vulnerabilities can be represented, based on terminology and the source of data. If you want to get pedantic, there are additional considerations that must be factored into these vulnerabilities.
In no particular order, these are other points that should not only be considered, but disclaimed in any presentation of the data above. While it may seem minor, at least one of these points could further skew vulnerability counts and severity distribution.
- MS12-080 Only contains 1 CVE if you look at immediate identifiers, but also contains 2 more CVE in the fine print related to Oracle Outside In, which is used by the products listed in the advisory.
- MS12-058 actually has no immediate CVEs! If you read the fine print, it actually covers 13 vulnerabilities. Again, these are vulnerabilities in Oracle Outside In, which is used in some Microsoft products.
- Of the 176 Microsoft vulnerabilities in 2012, as tracked by OSVDB, 10 do not have CVE identifiers assigned.
- OSVDB 83750 may or may not be a vulnerability, as it is based on a Microsoft KB with uncertain wording. Vague vulnerability disclosures can skew statistics.
- Most of these CVSS scores are taken from the National Vulnerability Database (NVD). NVD outsources CVSS score generation to junior analysts from a large consulting firm. Just as we occasionally have mistakes in our CVSS scores, so does NVD. Overall, the number of scores that have serious errors are low, but they can still introduce a level of error into statistics.
- One of the vulnerabilities (OSVDB 88774 / CVE-2012-4792) has no formal Microsoft advisory, because it is a 0-day that was just discovered two days ago. There will almost certainly be a formal Microsoft advisory in January 2013 that covers it. This highlights a big problem with using vendor advisories for any statistic generation. Vendors generally release advisories when their investigation of the issue has completed, and a formal solution is made available. Generating statistics or graphics off the same vulnerabilities, but using disclosure versus solution date will give two different results.
These are just a few ways that statistics can be manipulated, often by accident, and why presenting as much data and explanation is beneficial to everyone. I certainly hope that SCMagazine and/or CORE will issue a small correction or explanation as to the what the “83” number really represents.